Introduction
This is a summary of first analysis results of responses from Japan to our COVID-19 and Mobility Questionnaire. The analysis is carried out with the responses collected by mid-day on 4th May 2020. The analysis is carried out by step-by-step and this post will be updated as further results become available.
Among 11,374 responses to the questionnaire at the time of the first analysis, 1,038 respondents (9.1%) live in Japan. Among them, 1,005 responded in the Japanese-language version, and 33 responded in the other language versions. This number of responses is the 3rd largest, after Austria (3,325 responses) and Hungary (1,944 responses). 613 responses were made by 31st March, and 452 are made in April.
Respondents
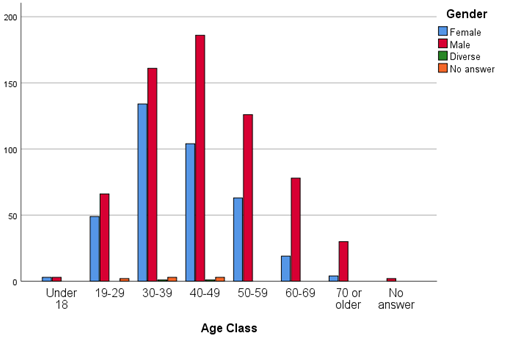
376 female, 652 male, and 2 diverse respondents provided the information about their gender, while 8 did not provide the information. The Table below is a summary of the number of respondents subdivided by the gender and age classes. About two-thirds of the respondents are male. The age classes 20s to 50s are dominant, and 85% of the total respondents are between 19 and 59 year-old. In Japan, approximately 20% of the inhabitants are 70 year-old or older according to the national statistics as of 1 January 2019, but this group has small in our sample. This is probably because of the online distribution of the questionnaire, and also because the questionnaire was spread by the sharing in social media to the Japanese respondents. Focusing on the age classes, female respondents tend to be younger than the male, and higher age groups has higher share of male respondents. It is unclear if this is also because of online distribution or for another reason.
| Respondents | Percentage | ||||||||||
| Female | Male | Diverse | No answer | Total | Female | Male | Diverse | No answer | Total | ||
| Age | Under 18 | 3 | 3 | 0 | 0 | 6 | 0% | 0.0% | 0% | 1% | 6 |
| 19-29 | 49 | 66 | 0 | 2 | 117 | 10% | 0% | 25% | 11% | 117 | |
| 30-39 | 134 | 161 | 1 | 3 | 299 | 25% | 50% | 38% | 29% | 299 | |
| 40-49 | 104 | 186 | 1 | 3 | 294 | 29% | 50% | 38% | 28% | 294 | |
| 50-59 | 63 | 126 | 0 | 0 | 189 | 19% | 0% | 0% | 18% | 189 | |
| 60-69 | 19 | 78 | 0 | 0 | 97 | 12.0% | 0% | 0% | 9% | 97 | |
| 70 or older | 4 | 30 | 0 | 0 | 34 | 4.6% | 0.0% | 0% | 3% | 34 | |
| No answer | 0 | 2 | 0 | 0 | 2 | 0.3% | 0.0% | 0% | 0% | 2 | |
| Total | 376 | 652 | 2 | 8 | 1038 | 100% | 100% | 100% | 100% | 1038 | |
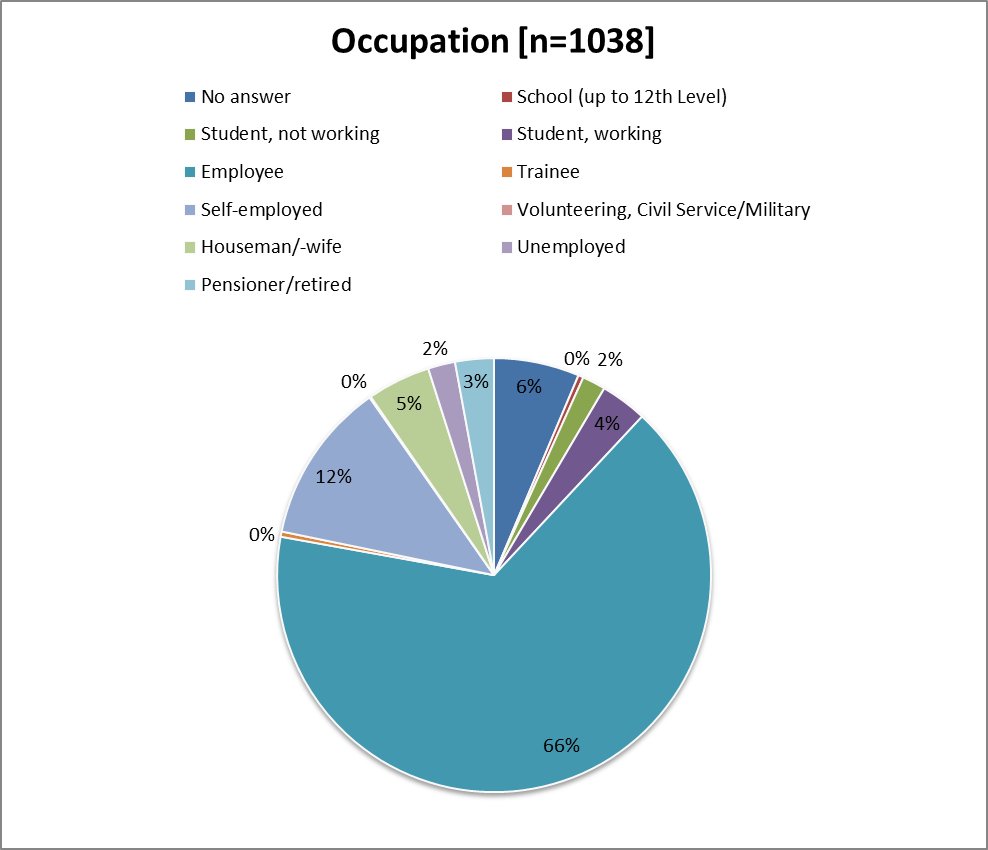
684 (65.9%) respondents are employees, and 125 are self-employed (12.0%): these groups together are more than three-fourth of the total respondents. This is in line with the respondents age classes, which is younger than the average.
With the postal codes (using the first 5 digits), 942 respondents provided the information about the prefecture and the municipality they live in. The Table below is a summary of the top 10 prefectures in terms of the number of respondents. Tokyo and Kanagawa have large shares among the respondents, making more than 50% together. With Saitama and Chiba prefectures added, the total share reaches to approximately 60%. These four prefectures in the Greater Tokyo Area together have about 28.7% of the total population in Japan. Therefore, the results from Japan have to be interpreted that the situation of the Greater Tokyo Area is strongly reflected. Of note, only 68 (6%) respondents are from Osaka, Kyoto and Hyogo Prefectures together.
| Prefecture | Respondents | Percentage | Note |
| Tokyo | 389 | 37.5 | |
| Kanagawa | 156 | 15.0 | Greater Tokyo Area |
| Aichi | 49 | 4.7 | Where Nagoya is located |
| Saitama | 42 | 4.0 | Greater Tokyo Area |
| Chiba | 39 | 3.8 | Greater Tokyo Area |
| Osaka | 27 | 2.6 | |
| Hokkaido | 26 | 2.5 | |
| Hyogo | 25 | 2.4 | Where Kobe is located |
| Miyagi | 16 | 1.5 | Where Sendai is located |
| Kyoto | 16 | 1.5 |
In this questionnaire, the highest education level is also asked. 967 respondents provided a valid in formation. Among them, 852 (82.1%) graduated from universities (including short-duration courses and graduate schools), and 35 (3.4%) graduated from job-oriented schools. These two groups, which are categorized as higher education in the available Japanese statistics, together have a very high share among respondents.
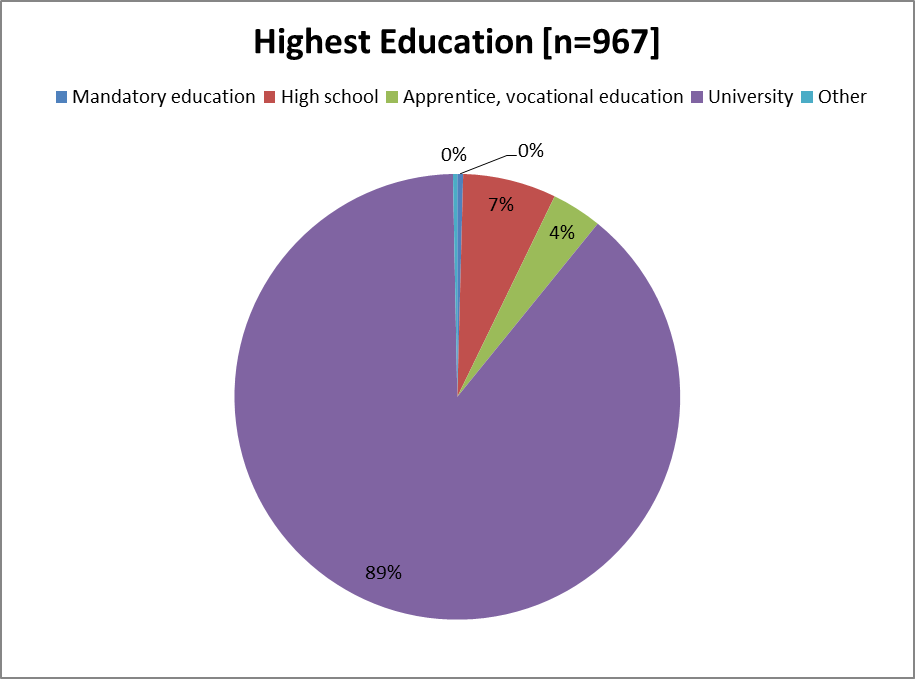
In Japan, the 2010 Census (large-scale census carried out in every 10 years) is the latest available data about the highest education among the population. According to this, among the population over 15, 32.2% graduated the higher education. In this 2010 census, the highest share with the higher education are among the cohorts of 25-29 year-old (56.7%) and 30-39 (56.1%) year-old, which are now 35-39 and 40-44 year-old. At large, the respondents to our questionnaire tend to have higher educational levels. This is probably because the survey was conducted by a university, and was distributed online through the university’s websites and social media.
Commuting travel
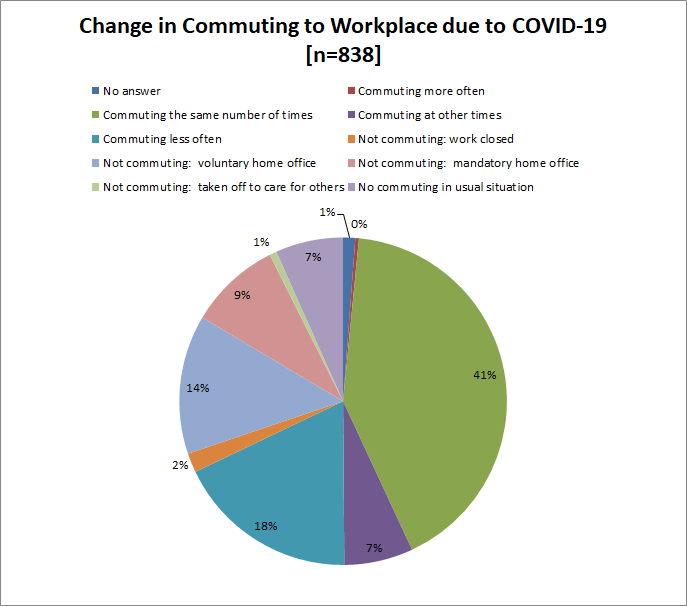
Among the respondents, 838 (81%) provided the information about commuting to workplaces, and 53 (5.1%) to the places of educations, accordingly to their job status. Among 838 workers, 358 (41%) reported no change, and 57 (7%) reported the change of the time of the day for commuting. 151 (18%) reported the decrease of the commuting frequency to the workplaces, 115 (14%) reported that they work now at home on their own will but home-office is not made mandatory, and 76 (9%) reported that they reported that home-office is made mandatory.
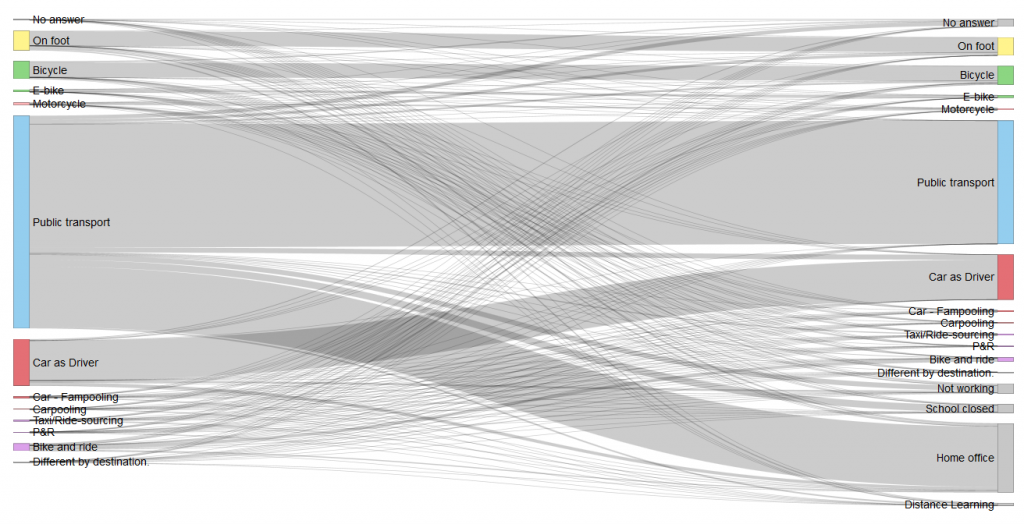
820 respondents provided the information about the commuting travel before the outbreak of COVID-19 and the changes in working style due to COVID-19. Before the COVID-19 outbreak, higher number of respondents (554 respondents) used public transport compared to the car (121 respondents). This is probably because of the high share of the respondents from Greater Tokyo Area, where the modal share of public transport is higher than the other regions. Walking (51 respondents) and Cycling (46 respondents) are also popular.
After the outbreak of the COVID-19, 179 respondents (22%) are working at home. Among these 179 respondents, 160 (89% of the respondents working now at home) used to commute by public transport or by a combination of bicycle and public transport. This implies that the home office is practiced more by those who used to commute by public transport.
Among the 554 respondents who used to commute by public transport, 321 (58%) did not change the mean of transport to commute after the outbreak of COVID-19. Among the 121 respondents who used to commute by car, 104 (86%) did not change the mean of transport. It is an interesting trend that the commuters using the car shifted less to the home office than those who used public transport.
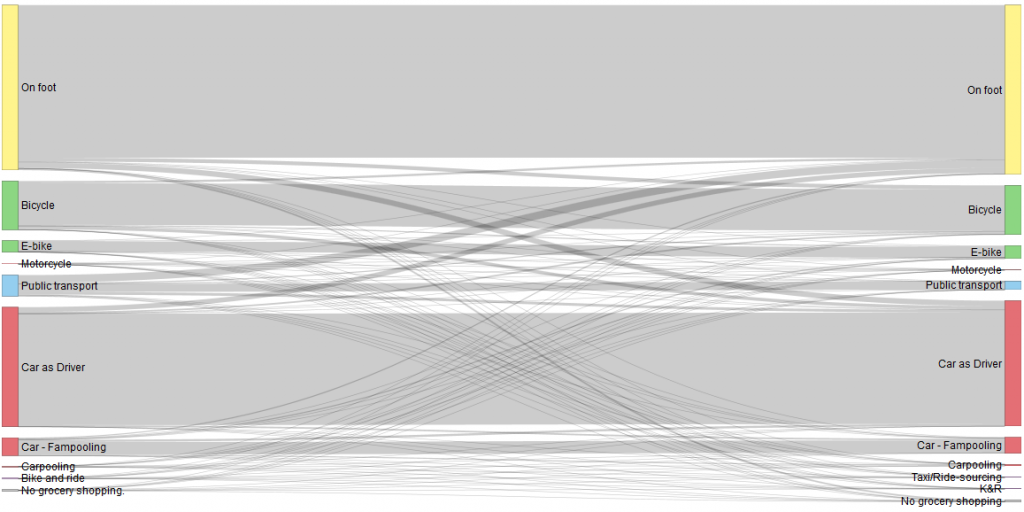
The figure is a summary of the changes in commuting trips, including changes to the home office.
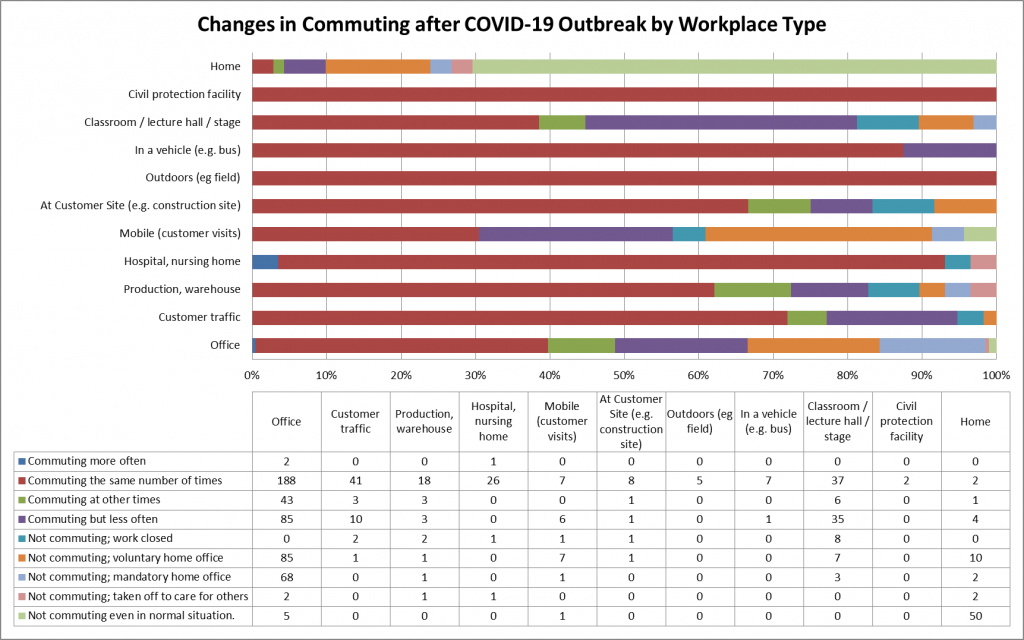
In this questionnaire, the type of workplace is also asked. The Figure X is a summary of the changes in commuting based on the type of workplaces. This confirms that the home office is practiced more by those whose workplaces are offices. In this group, the reduction of the commuting frequency is also visible. In addition, the respondents with the workplace type “visiting customers” also tend to have shifted to home office or reduced the commuting frequency, but the number of the respondents in this group is not large. The reduced frequency of commuting is also observed among those who work in lecture rooms, theaters, and so on, where the lecture, performance, speech or alike is undertaken: this is probably a reflection of distance learning or online streaming of live performance without the presence of audiences.
Changes in Grocery Shopping
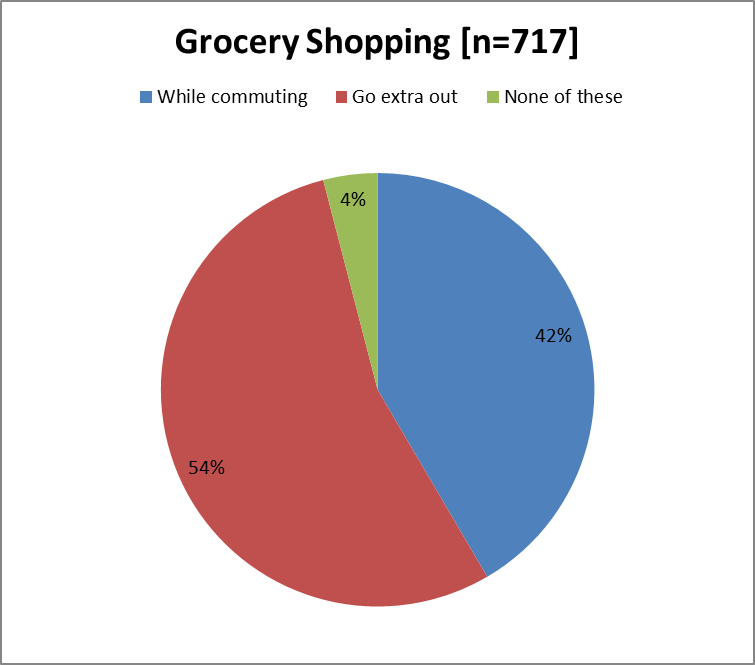
42% of the respondents answered that they tend to buy groceries on the way to or from the workplace or place of education. 54% of respondents answered that they tend to go out extra to buy groceries.
A Sankey Diagram is made for the travel behavior for grocery shopping before and after the outbreak of COVID-19. In comparison to the changes in commuting travels, very limited changes are observed in this respect.